- No table of contents items configured
Published: July 26, 2024

Written by: Michael Malone
Reading time: 2mins
Table of Contents:
- No table of contents items configured
Which Counties Install the Most Solar Panels Per Capita?
Dublin has among the lowest solar installation rates per capita in Ireland.
Only 1 county in the “sunny southeast” makes the top 5.
Three Ulster counties are included in bottom 5.
Despite a reduction in SEAI grants at the beginning of 2024, solar PV installation rates in Ireland remain high.
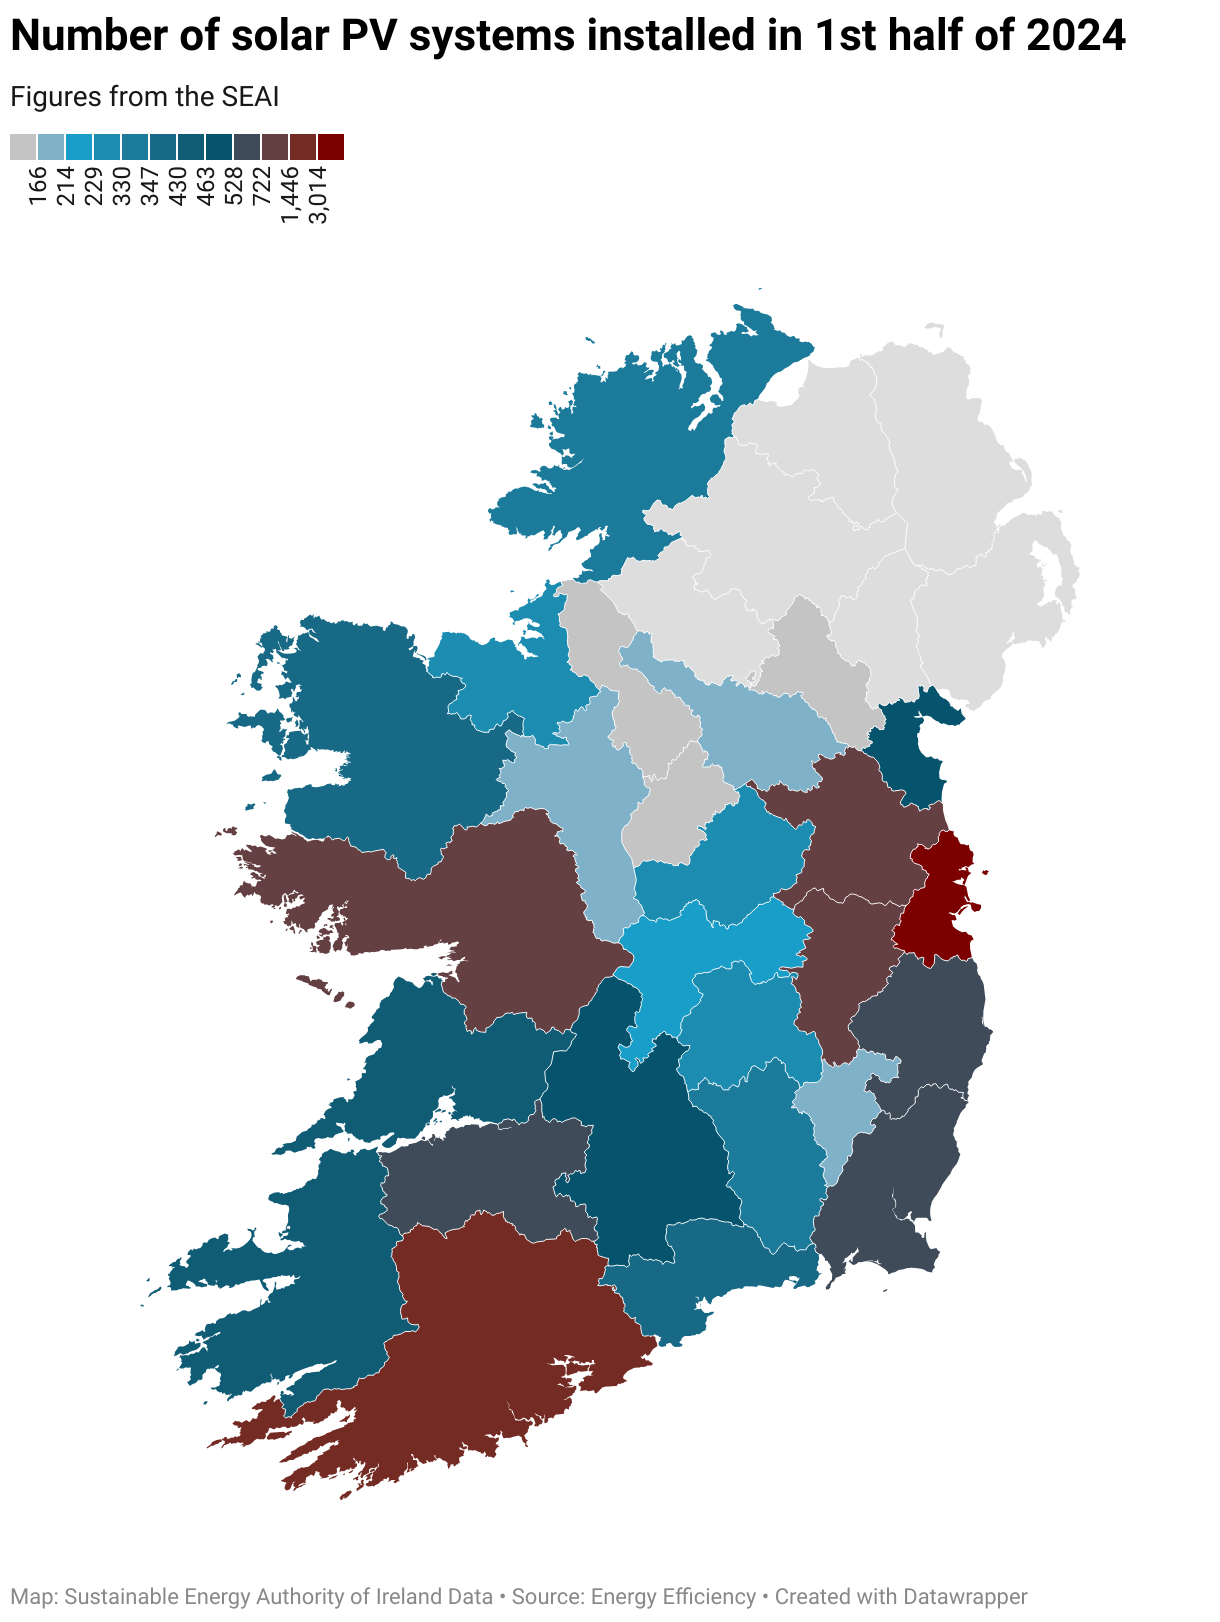
In Q2, there were 7,493 grant assisted solar PV installations across the country – an increase of almost 1,500 (+24%) compared to Q1.
Because Dublin and Cork have the largest populations, it is no surprise that they also have the most solar installations so far in 2024.
But which counties have the highest and lowest installation rates per capita?
To find out, EnergyEfficiency.ie, Ireland’s leading energy efficiency experts, analysed SEAI solar PV installation statistics for each county for the first half of 2024, as well as the population data from the most recent Census.
The study produced some interesting results – so let’s have a look at each county to see where they stand with solar PV installations per capita.

5 Counties with Most Solar Installations Per Capita
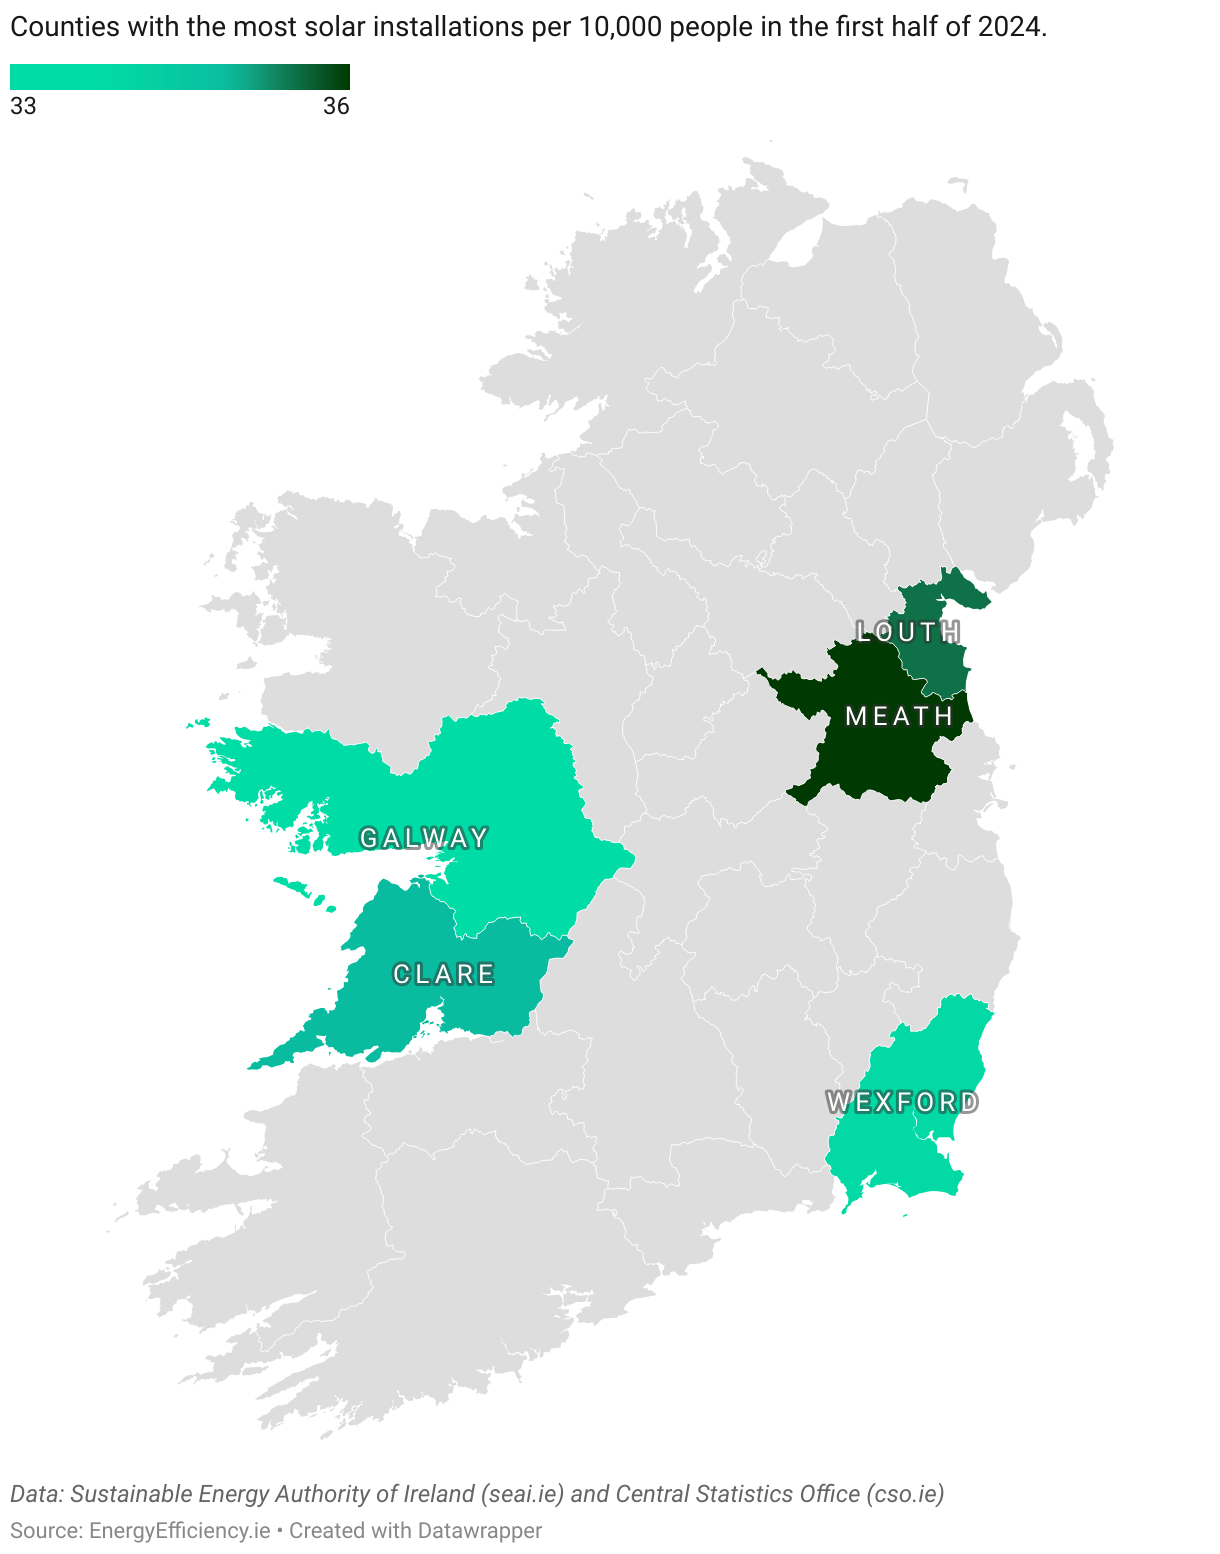
- Meath – 36.14 installations per 10,000 people
- Louth – 35.52 installations per 10,000 people
- Clare – 34.93 installations per 10,000 people
- Wexford – 33.94 installations per 10,000 people
- Galway – 33.83 installations per 10,000 people
Co. Meath takes top spot with the most installations per capita in the first half of 2024, while neighbouring Louth was a fraction behind the Royal County. Fine margins indeed.
Interestingly, only Wexford in the “sunny southeast” makes the top 5 – despite the region getting the most hours of sunshine per year and therefore most suited to solar PV.
Although Carlow and Kilkenny do make the top 10, Waterford is bang smack in the middle of the list of counties, while Cork is nowhere to be seen at 18th.
But all 5 of these counties are also among the top 10 counties which get the most sunshine hours in Ireland.
5 Counties with Fewest Solar Installations Per Capita

- Longford – 16.08 installations per 10,000 people
- Monaghan – 18.98 installations per 10,000 people
- Donegal – 19.60 installations per 10,000 people
- Cavan – 20.30 installations per 10,000 people
- Dublin – 22.04 installations per 10,000 people
Longford had less than half the number of grant assisted solar PV installations in the first 6 months of the year than any of the top 5. In total, there were only 74 installations in the county in during the first half of the year according to SEAI data.
Just above Longford are 3 of the counties of Ulster – Monaghan, Donegal and Cavan.
It is interesting to note that Cavan and Longford are among the worst 5 Building Energy Rating (BER) performers – with only 5% of buildings in those counties rated ‘A’.
Dublin is more difficult to compare due to its incomparable population size, and Dublin City having more apartments per capita than the rest of the country.
We know from Census 2022 data that only 3% of households in Dublin City reported having solar panels, compared to 11% of households in Meath. Our study suggests that this trend is the same two years on.
Solar Installations per Capita

Summary
13,498 solar installations were carried out across the country with SEAI grant support in the first 6 months of 2024 and a total of €54,737,280 was paid through Individual Energy Upgrade Grants, which help homeowners with energy upgrades such as heat pumps, insulation and solar PV.
Looking at the installations per capita table, the 5 counties at the bottom are all border counties with the exception of Longford, while the top 5 are all coastal counties with the exception of Meath.
And while there has been a large variation in installation per capita between counties like Longford and Meath so far this year, we will have to wait to analyse further when the final figures for 2024 are released, to gain a larger sample size over a longer period. This will give us a clearer picture of where solar panels are most popular in Ireland – and why.
Sources: Statistics for National Home Retrofit Programmes | SEAI
Solar energy saves households thousands in electricity costs
Take our 2-minute questionnaire and find affordable solar options to suit your budget and lifestyle.
