- No table of contents items configured
Published: August 20, 2024

Written by: Michael Malone
Reading time: 2mins
Table of Contents:
- No table of contents items configured
Comparing Solar PV Per Capita across Europe
The key takeaways:
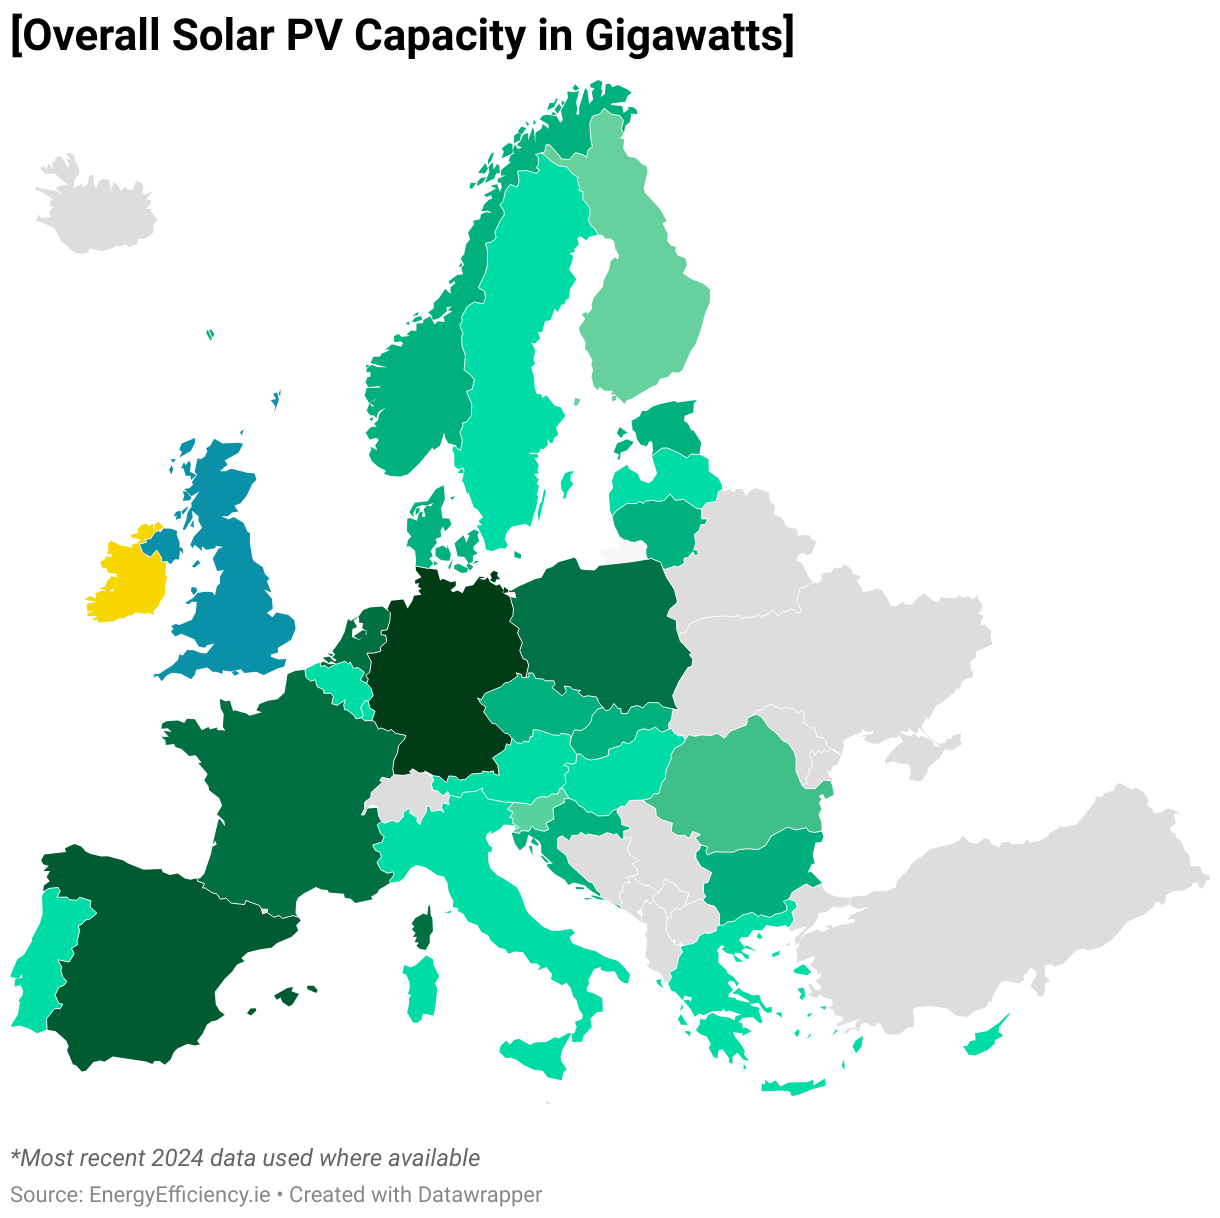
Germany’s solar capacity is set to rise to 88.9 GW in 2024
The United Kingdom is falling behind on a solar PV per capita basis
The Netherlands has the highest PV capacity per inhabitant in the EU
Solar panels have become widespread across Europe over the past decade, and growth is not slowing.
Some 56GW of solar PV capacity was installed across the EU 27 in 2023 – a 40% increase on 2022.
By comparison, is estimated that solar PV panel systems with an output of around 840 GW were newly installed in Asia in 2023.
Outright solar capacity comparisons between continents are swayed by huge variations in population size – and this is the same for individual countries.
For this reason, calculating solar capacity per capita is a fairer way of calculating where each country stands.
Methodology
To calculate the photovoltaic solar PV capacity per capita in Ireland, the United Kingdom and mainland Europe, we first looked at the overall capacity in each country for which recent data was available. For Ireland and the UK, this data was updated in 2024.
To calculate solar PV per capita across the continent, we gathered the most recent population statistics available for each country. In Ireland, the CSO published an updated population estimate in 2024. For the UK and EU countries, the most recent Census data was used.
This allowed us to demonstrate which countries were overachieving in terms of solar PV as it took population size into account.
Solar PV Capacity Per Capita in Europe
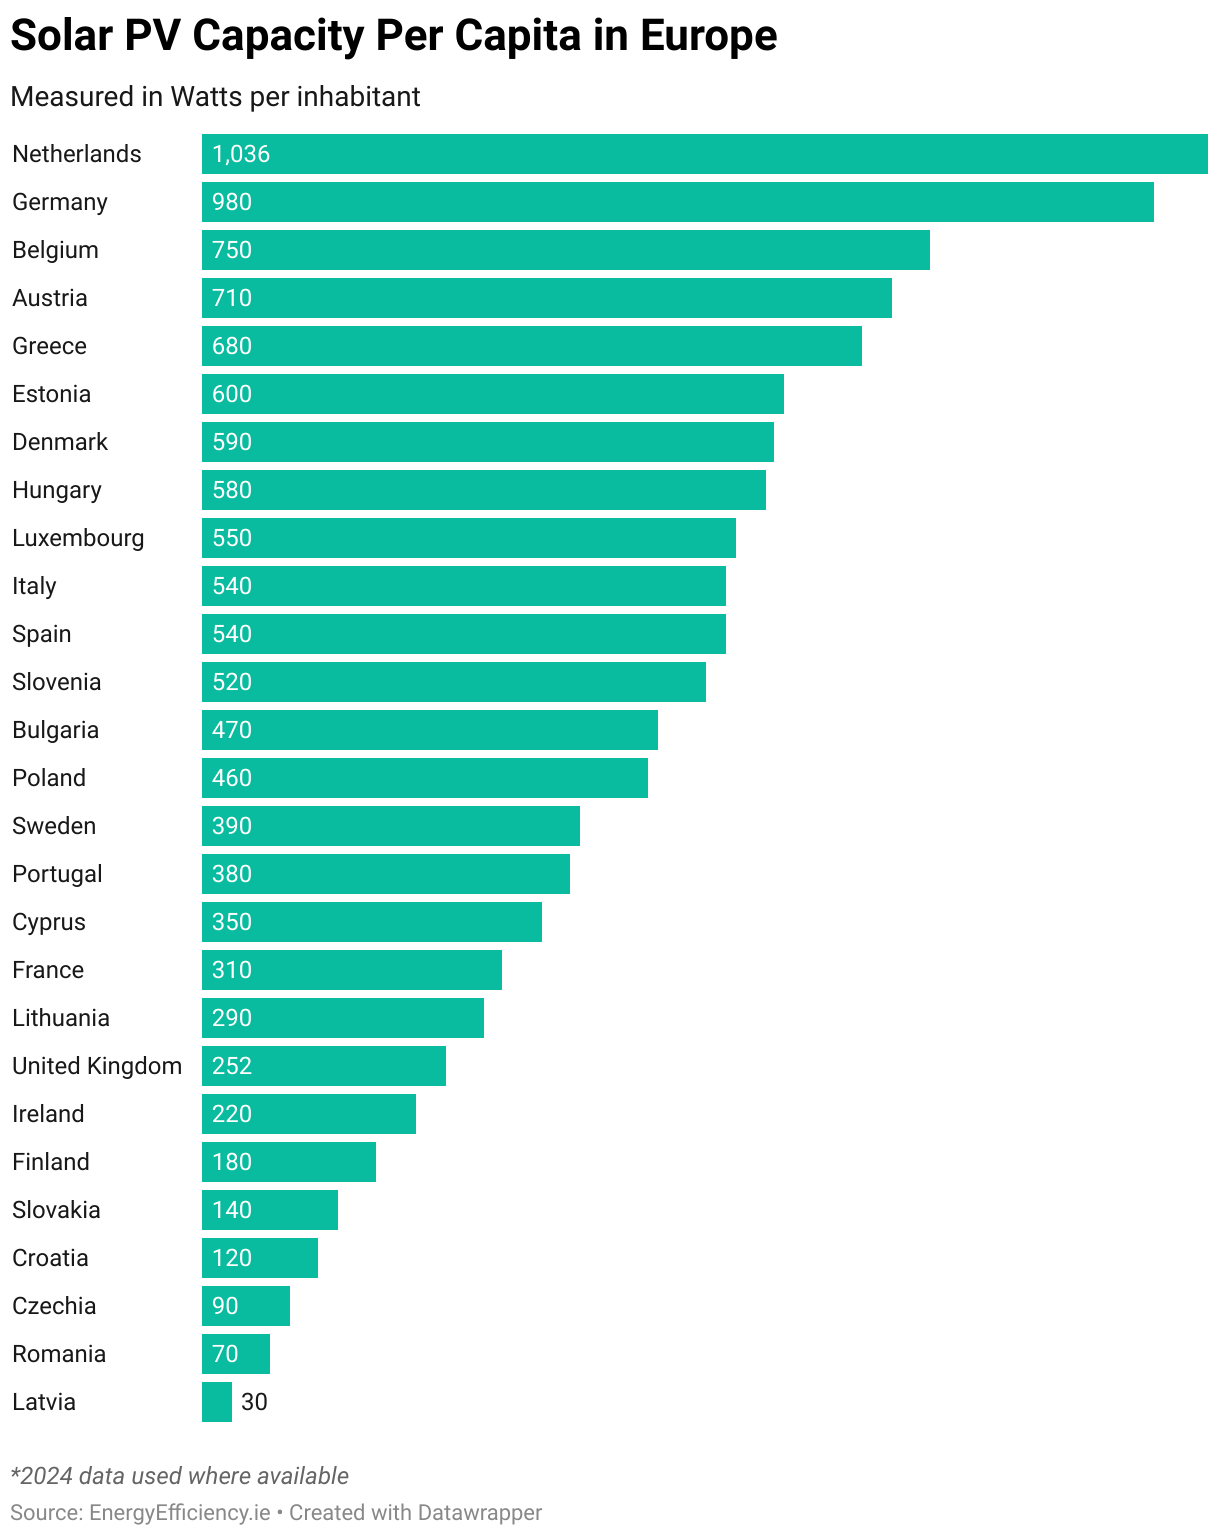
Ireland’s solar capacity per capita in 2024 is similar to its closest neighbours in the UK – with 220 W per person in Ireland and 252 W in the UK.
The UK has a much larger population, of course, with 67 million, and 2024 data shows the country has 16.9 GW of solar capacity.
While Ireland might be keeping up with its closest neighbours, both countries fall significantly behind most other European countries.
Germany, one of the leaders in solar energy in Europe, had 82.6 GW after Q2 2024, and this is expected to reach 88.9 GW by the end of the year.
That works out at 978 W per inhabitant — around 4 times more than the UK and Ireland.
Spain was one of the first EU countries to truly embrace solar energy, and in 2023, the country further increased its solar PV capacity by an impressive 28%.
This added almost 6 GW to take its overall capacity to 25.5 GW.
This means the photovoltaic capacity in Spain is 535 W per inhabitant.
France falls behind both Germany and Spain when it comes to overall solar PV capacity, with 21,100 MW in total at the end of March 2024.
With a population of 68 million, this works out at 310 W per person in France.
Italy recorded a photovoltaic capacity of over 32GW in March 2024, so its per capita figure is 540 W per person.
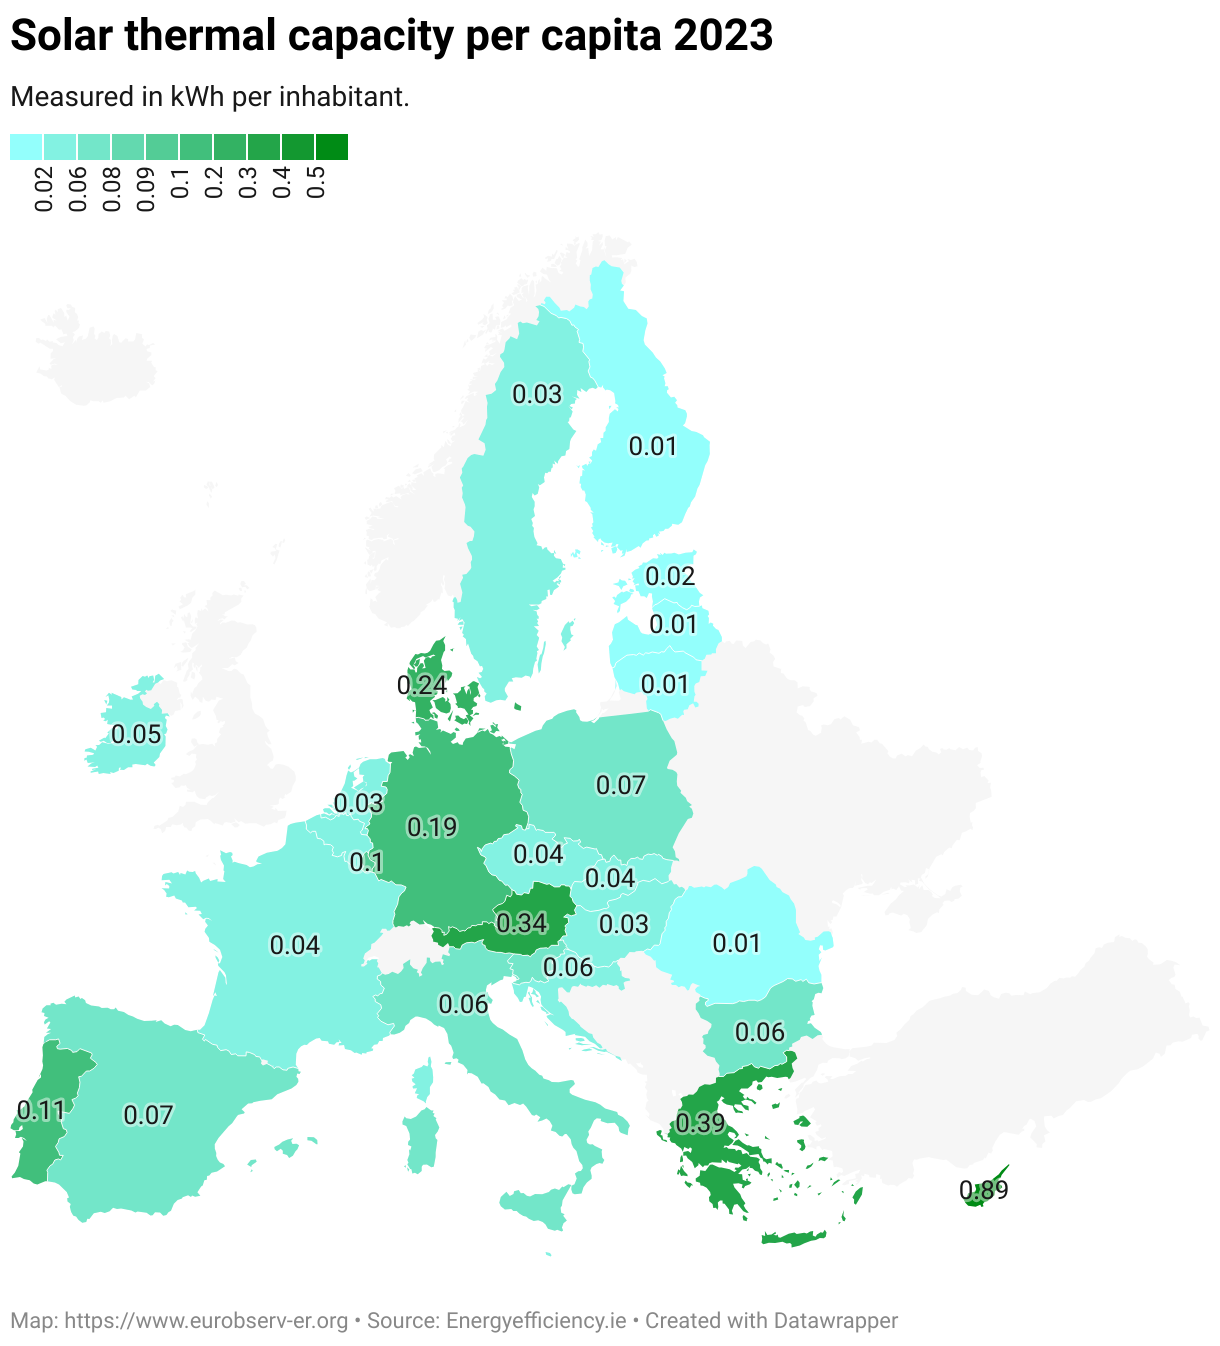
Solar Thermal Capacity per Capita in the EU (kwTh)
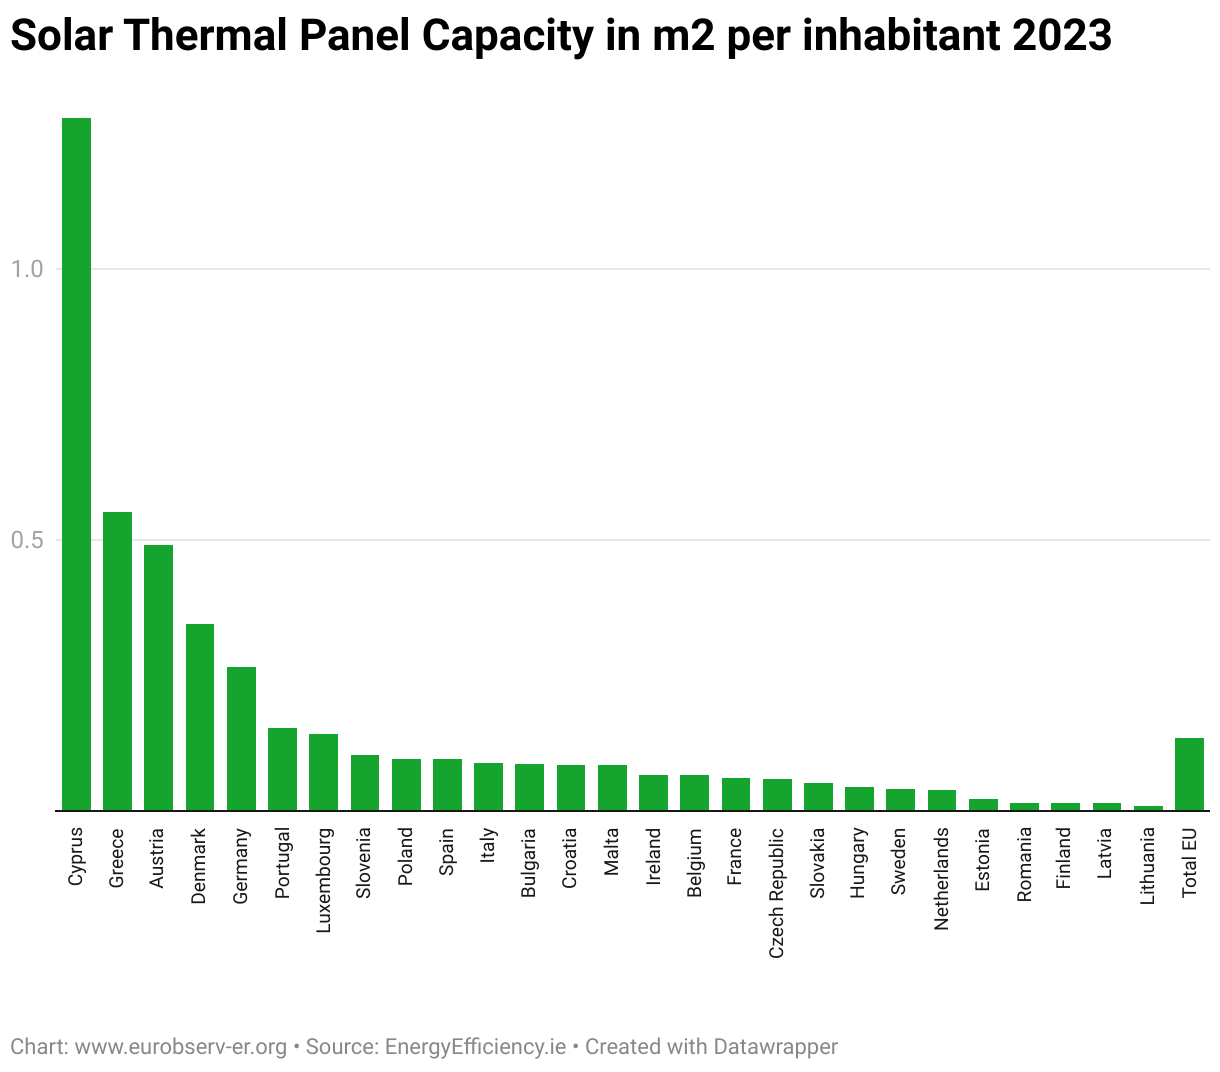
Total thermal solar panels installed in m2
Solar energy saves households thousands in electricity costs
Take our 2-minute questionnaire and find affordable solar options to suit your budget and lifestyle.
